Total luminosity inspector
Brilview application has a total luminosity inspector component for plotting total luminosity values.
Total luminosity component is meant for querying total luminosity from brilcalc and visualising it in 4 types of charts:
Luminosity values - Luminosity values chart
Luminosity ratios - Luminosity ratios chart
Pileup - Pileup chart
Cumulative luminosity - cumulative
Charts can be shown/hidden by toggling the switches at the bottom of the page (see image bellow).

Querying
Data queries are performed using Query panel at the top of the page.
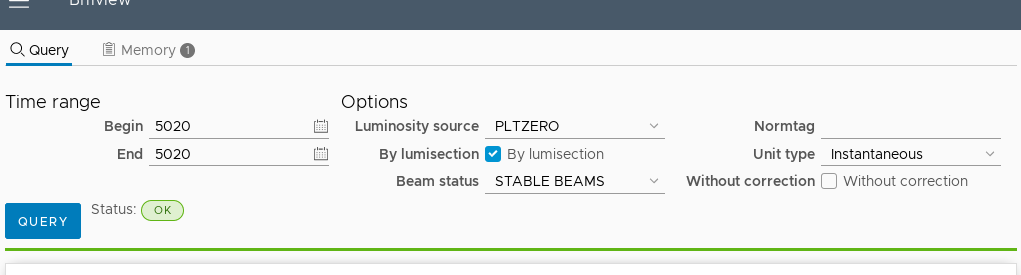
Fill in fields in “Time range” and “Options” sections, and hit “QUERY” button. Next to the button there is a status indicator which also shows error messages in case of failed queries. After successful query, new data is stored in memory (see Memory).
Note
Normtag field accepts single iovtag/normtag, or multiple comma separated iovtags/normtags. Normtag files are available from BRIL CVMFS repository: /cvmfs/cms-bril.cern.ch/cms-lumi-pog/Normtags/
Memory
Memory is an in-browser cache for queried data. It holds up to 10 query results (dropping the oldest ones when full). Chart containers access this memory to pick data for plotting. To inspect current memory switch to “Memory” tab at the top of the page (see image bellow).
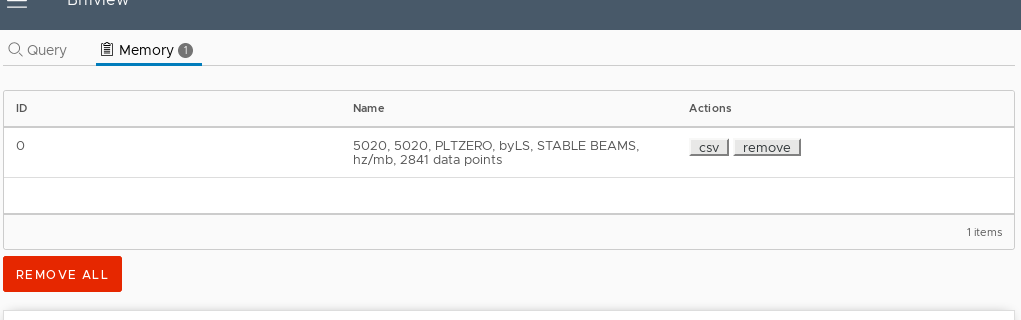
From this “Memory” tab you have ability to:
remove results from memory
all at a time with “REMOVE ALL” button
or one by one with “remove” button next to each result
download CSV file for each result by clicking “csv” button next to it
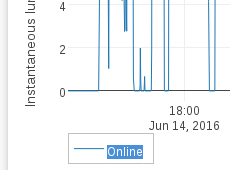
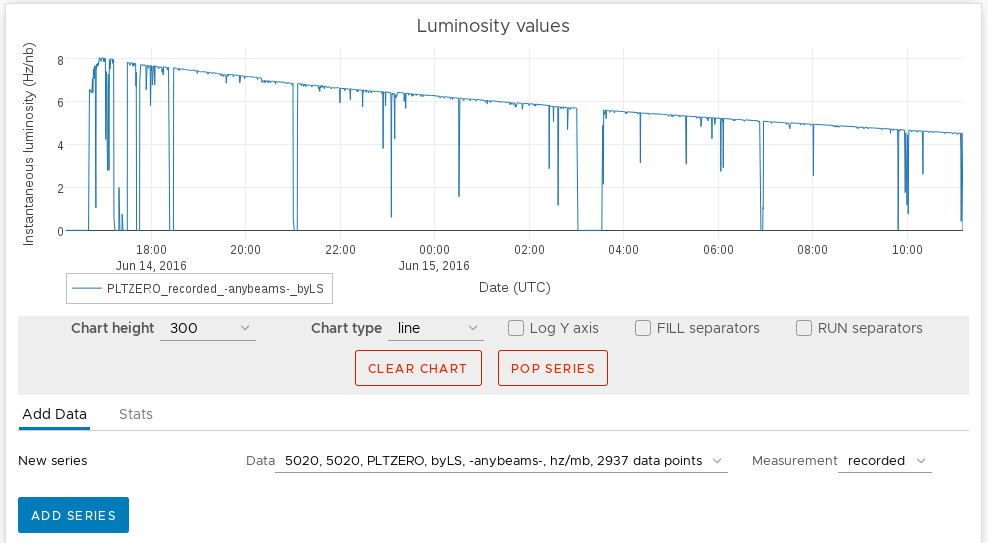
Luminosity values chart
This chart displays plain queried data values. In contrast to other charts, this one is automatically populated (if possible) with delivered luminosity data after successful query. You can also add series manually from memory using form in the “Add series” tab at the bottom of chart container.
Cumulative luminosity chart
This chart works almost the same as plain luminosity chart (see Luminosity values chart) and the only difference is that it recalculates values to add up with time for each series. Use form in the “Add series” tab at the bottom of the chart container to add series.
Luminosity ratios chart
This chart is for plotting ratios between two series of data. Using form at the bottom of chart container choose (manually from dropdowns, or by cycling permutations with two arrow buttons) two data series from memory to make ratio and click “ADD RATIO” button. When adding series, timestamps of data points might be slightly modified to align lumisections.
Pileup chart
This chart is for plotting pileup values. Use form in the “Add series” tab at the bottom of the chart container to add series. This chart can only use data which had “Query pileup” checkbox checked in Query form.
Cumulative luminosity chart
This chart works almost the same as plain luminosity chart (see Luminosity values chart) and the only difference is that it recalculates values to add up with time for each series. Use form in the “Add series” tab at the bottom of chart container to add series.
Stats
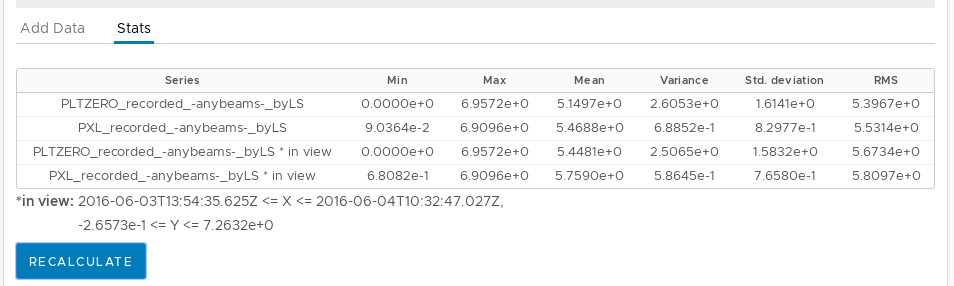
Few statistical numbers for data of each chart can be calculated by clicking “RECALCULATE” button in “Stats” tab at the bottom of chart container (see image below). Numbers are calculated twice per each series: for whole series data, and for data only falling in visible (zoomed) chart area.
Common chart controls
For all charts in this total luminosity component there are few common controls. The common controls are placed immediately bellow each chart (see image bellow).
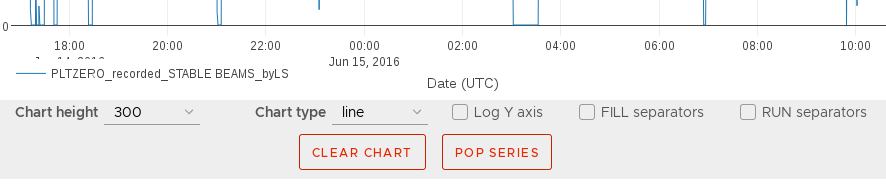
Controls:
Chart height: chart height in pixels
Chart type: how chart is drawn - lines, bars, dots, etc.
Log Y axis: should Y axis be of logarithmic or linear scale
FILL separators: put vertical lines on FILL number change
RUN separators: put vertical lines on RUN number change
CLEAR CHART: remove all series from chart
POP SERIES: remove single last series from chart
In chart navigation
Useful chart navigation methods:
Mode bar “Zoom Y axis 0;3” button: shortcut to set Y axis range 0-3 (useful for ratios)
Mode bar “Zoom in”/”Zoom out” buttons: zoom in/out
Click and drag with “Zoom” tool selected: zoom to region
Double click axis scale: auto reset zoom for the axis
Click and drag axis scale edge: zoom by by “squashing”/”expanding” from the edge
Click and drag axis scale (center): pan horizontally/vertically
Click and drag with “Pan” tool selected: pan freely
Double click on chart canvas: auto reset zoom to fit everything
Editable charts
Chart title, axis titles, and series names can be modified by clicking on them and typing new text (see image bellow).